
Consulting services
From tracking spreadsheets to a clear view of the whole business
A consulting business running many engagements at once could not see how the business, each project or each consultant was really performing. We built a dashboard that reads the spreadsheets they already had.
- Business
- Consulting services, Melbourne
- Bottleneck
- No clear top-down view across many concurrent engagements
- Built
- A performance dashboard fed by the spreadsheets already in use
- Result
- Utilisation, budgets and availability visible at a glance
Inside the app
What was happening before
The business was running many client engagements at once, and every consultant's week was a mix of billable site time, new business development, downtime between jobs and time off. The information all existed — it sat in the tracking spreadsheets the team already kept — but no one could easily answer the simple questions: how is the business tracking overall, how is each project performing against budget, and when can we safely take on new work?
What we looked at in the walkthrough
In the 45-minute discussion we mapped where the decisions were being made blind. The problem was not a lack of data — the spreadsheets had everything — it was that reading performance out of them took hours and was rarely done. The task was a structured, repeatable one: draw the same data out of the same spreadsheets, the same way, every week, and present it so a decision can be made in minutes.
What we built
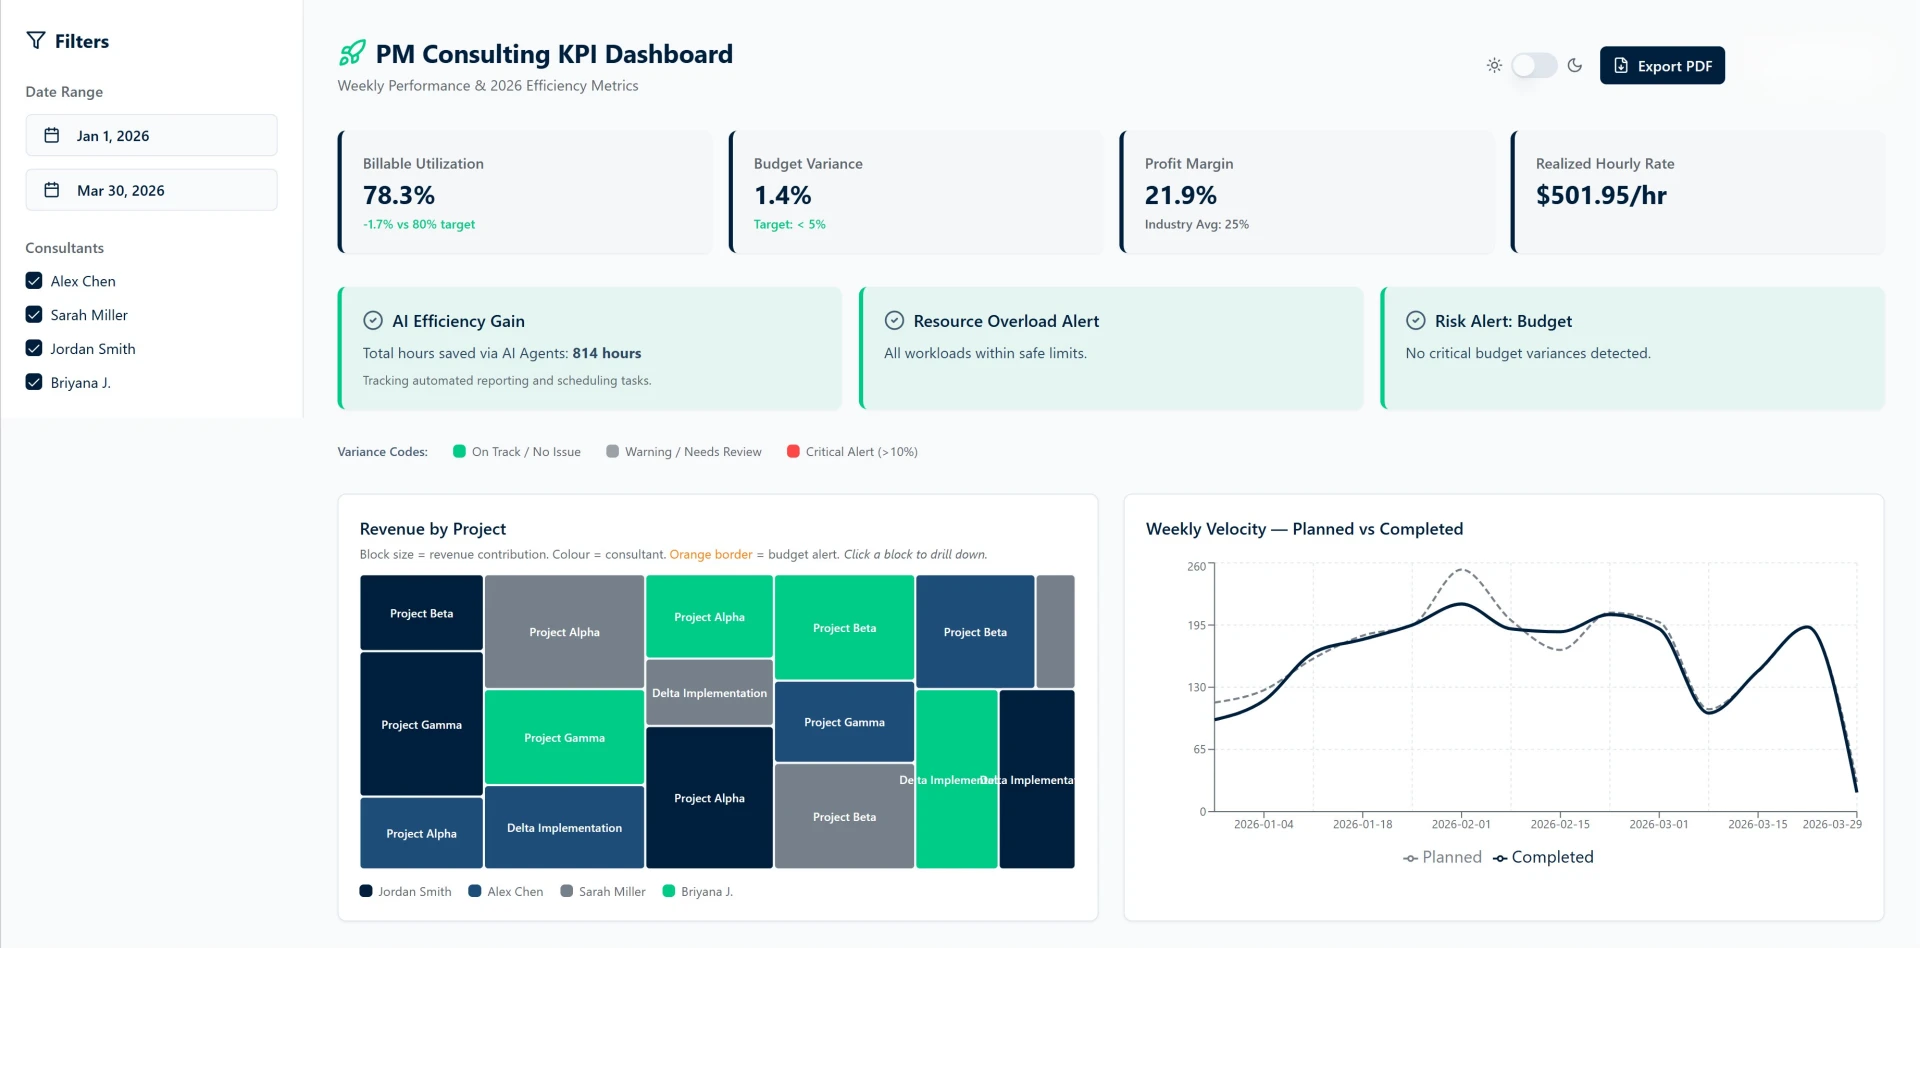
A performance dashboard that draws directly from the tracking spreadsheets the business already had — no new data entry, no new system for the team to learn. It shows billable utilisation against target, budget variance on each project, profit margin, realised hourly rate, revenue by project, and weekly planned-versus-completed work. Alerts flag where resources are stretched or a budget is drifting, so issues surface before they cost money.
Why it stuck
It uses what the business was already doing. Nothing new to fill in, nothing extra to maintain — the spreadsheets stay exactly as they were, and the dashboard turns them into a picture the owner can read in minutes. Because it runs off the same data every week, the whole team is looking at the same numbers, and resourcing conversations start from facts instead of impressions.
The outcome
The owner now has a top-down view of the business that simply did not exist before: how each project and each consultant is performing, where resource constraints are putting delivery at risk, and where there is genuine capacity to book new work. Forecasts of consultant availability are more reliable, people are managed against clear targets, and clients get firmer commitments the business can keep.
If you are still working out which tasks would be worth handing over, start with how to choose the right AI tasks and tools, or see the other client stories.
Want a second opinion on your own task list?
Bring the jobs that eat your week and we'll talk through which of them AI can genuinely take on, and what that would be worth to you. The First AI Win package is $599 + GST in Australia, one-off, including the proposal, up to three agreed solutions, configuration, staff induction, guided installation, operating instructions and support until agreed measures are met.
Prefer to talk first? Call or email us.